 |
|||||||||||||
|
||||||||||||||||||||||||||||||||||||||||||||||||||||||||||||||||||||||||||||||||||||||||||||||||||||||||||||||||||||||||||||||||||||||||||||||||||||||||||||||||||||||||||||||||||||||||||||||||||||||||||||||||||||||||||||||||||||||||||||||||||||||||||||||||||||||||||
| Comparison of City EAV Growth Rate to TIF District EAV Growth Rate 2004-2009
Because of the difference in the number of TIF Districts in each year, we elected to use the annual percentage change in EAV growth to more accurately compare the annual TIF District EAV growth to the annual City EAV growth. Between 2004 and 2005, 63 of 134 TIF Districts (or 47.01% of TIF Districts) exceeded the City’s EAV growth rate. 15 Between 2005 and 2006, 82 of 136 TIF Districts (or 60.29% of TIF Districts) exceeded the City’s EAV growth rate. Between 2006 and 2007, 65 of 136 TIF Districts (or 47.79% of TIF Districts) exceeded the City’s EAV growth rate. Between 2007 and 2008, 48 of 147 TIF Districts (or 32.65% of TIF Districts) exceeded the City’s EAV growth rate. Between 2008 and 2009, 81 of 153 TIF Districts (or 52.94% of TIF Districts) exceeded the City’s EAV growth rate. Based on our analysis and after excluding the outliers, as described in the Research Methodology Section, the average increase in the EAV of all of the City’s TIF Districts exceeded the overall EAV increase in the City in each year-over-year period. Between 2004 and 2005, the average TIF District EAV increased by 14.23% and the City EAV increased by 7.99%. Between 2005 and 2006, the average TIF District EAV increased by 30.89% and the City EAV increased by 18.84%. Between 2006 and 2007, the average TIF District EAV increased by 10.24% and the City EAV increased by 6.38%. Between 2007 and 2008, the average TIF District EAV increased by 8.83% and the City EAV increased by 7.43%. Between 2008 and 2009, the average TIF EAV increased by 6.19% and the City EAV increased by 4.90%. The following graph provides a summary of the annual City EAV growth as compared to the average annual TIF EAV growth. Overall, the year-over-year average TIF District EAV increased by 14.08% between 2004 and 2009 and the year-over-year average City EAV increased by 9.11% over this same period. 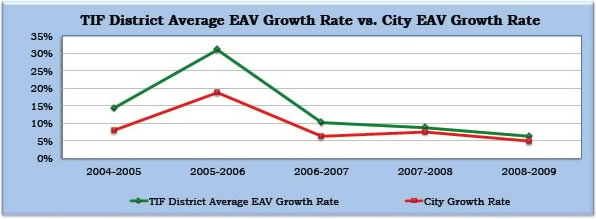 |
||||||||||||||||||||||||||||||||||||||||||||||||||||||||||||||||||||||||||||||||||||||||||||||||||||||||||||||||||||||||||||||||||||||||||||||||||||||||||||||||||||||||||||||||||||||||||||||||||||||||||||||||||||||||||||||||||||||||||||||||||||||||||||||||||||||||||