Comparison of City EAV to TIF District EAV by Region 2004-2009
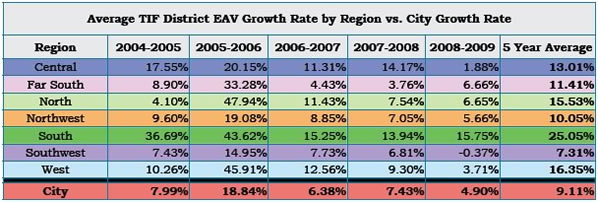
We also analyzed the EAV growth rates for TIF Districts in each region of the City in order to determine
whether certain regions accounted for the majority of TIF EAV growth. Based on the data, the five-year
average EAV growth rate of all but one region exceeded the City’s five-year average EAV growth rate.

The five-year average EAV growth rate for each region was calculated by taking the average of the
regional year-over-year growth rates for the years 2004 through 2009. The five-year average EAV
growth rate for the City was calculated by taking the average of each City year-over-year growth rate for
2004-2009.
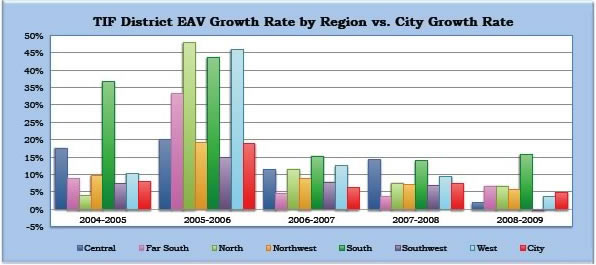
The following graph summarizes regional TIF EAV growth compared to City EAV growth.

In each year-over-year period, a majority of the regions experienced higher average EAV growth rates
compared to the City’s EAV growth rate. The South Region experienced an EAV growth rate higher than
the City’s EAV growth rate in each year-over-year period.
|
