 |
Appendix
|
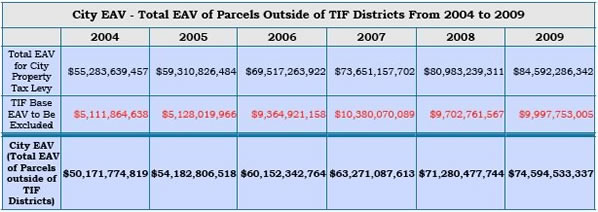
In order to calculate the year-over-year growth rate of the City EAV, we further adjusted the City EAV
data. Because certain TIF Districts were created and others either terminated or expired between 2005
and 2009, the parcels outside the TIF Districts changed in each year, artificially impacting the City EAV
amount. In order to mitigate the impact of the creation or termination of TIF Districts on the City EAV
data, we adjusted the City EAV data as follows:
• We added the base EAV amount of any new TIF Districts created since 2004 back to the City EAV.
For example, the LaSalle Central TIF District was established in 2006 with a base EAV of
$4,192,663,826. Because of its establishment, the 2006 EAV amount of all parcels located in LaSalle
Central TIF District ($4,192,663,826 ) was excluded from the 2006 City EAV although the 2005 EAV
amount of all of the parcels was included in the 2005 City EAV, artificially reducing the 2006 City
EAV and the 2005 - 2006 City EAV growth rate. To eliminate this artificial reduction, we adjusted the
City EAV from 2006 to 2009 by adding back the LaSalle Central TIF District’s base EAV.
• We subtracted the total EAV amount of any TIF Districts that terminated or expired before 2009. For
example, when the Central Loop TIF District expired in 2008, all parcels located in the Central Loop
TIF District became parcels outside of TIF Districts and therefore the Central Loop TIF District’s total
EAV amount ($3,184,101,518) became a part of the 2008 City EAV even though the 2007 EAV
amount of all parcels in the Central Loop TIF District was not included in the 2007 City EAV,
artificially increasing the 2008 City EAV and the 2007 - 2008 City EAV growth rate. To eliminate this
artificial increase, we adjusted the 2008 and 2009 City EAV by subtracting the Central Loop TIF
District’s total EAV.
|
