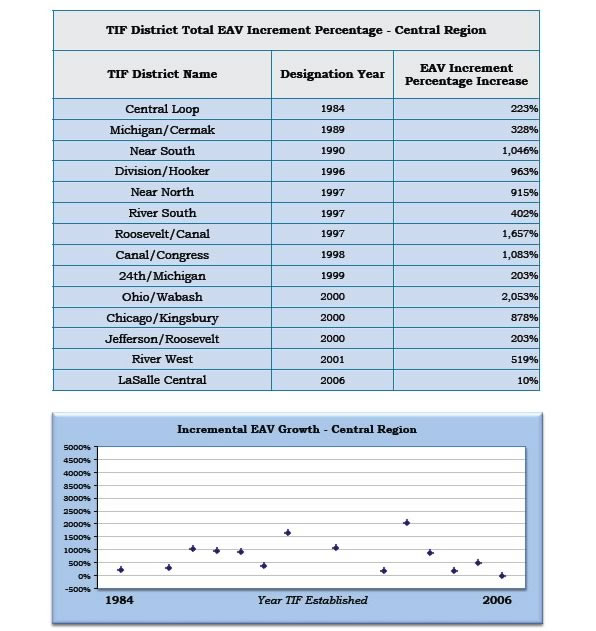
The following graphs show the percentage differences for all of the TIF Districts in each of the seven regions of the City.
©2011 Polsky & Associates, Ltd | All rights reserved